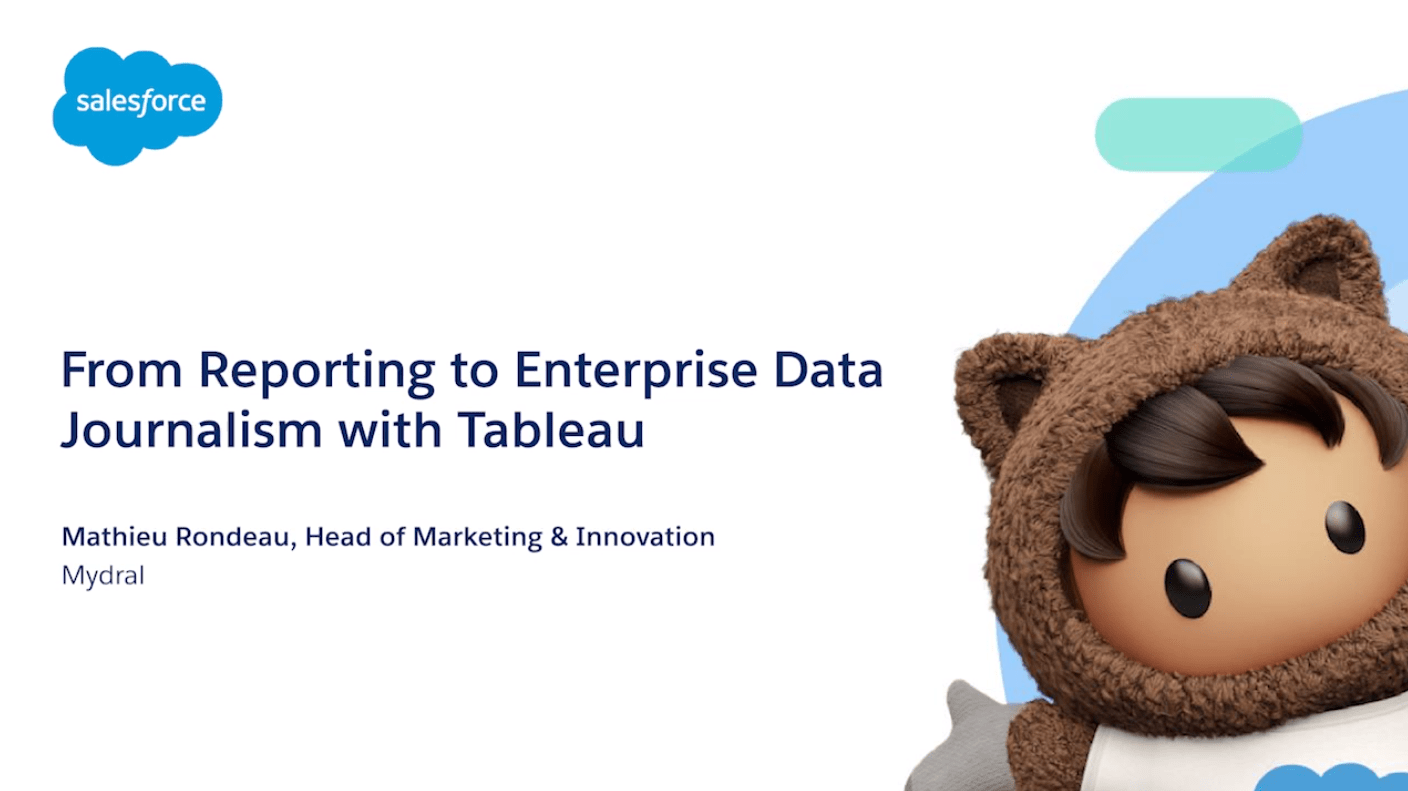
Salesforce + : watch our video “From Reporting to Enterprise Data Journalism with Tableau “

Watch now our episode with Salesforce +
Salesforce + episode 17 : available in the Industry Channels section !
We’re so glad to present our exclusive episode “From Reporting to Enterprise Data Journalism with Tableau”.
The future of analytics is coming with enterprise data journalism. A narrative storyboard integrated with Tableau/Salesforce makes self-service BI a competitive advantage for all modern companies.
Why Enterprise data journalism is on the rise ? Watch our experts and customers ! Hear Philippe Minier, Chief Information Officer at Kaufman & Broad and Antonio COSMA, Head of the National Cytometry Platform, at The Luxembourg Institute of Health, discuss keys to success with data and Tableau.
Watch now the epsiode by clicking in the image below 👇
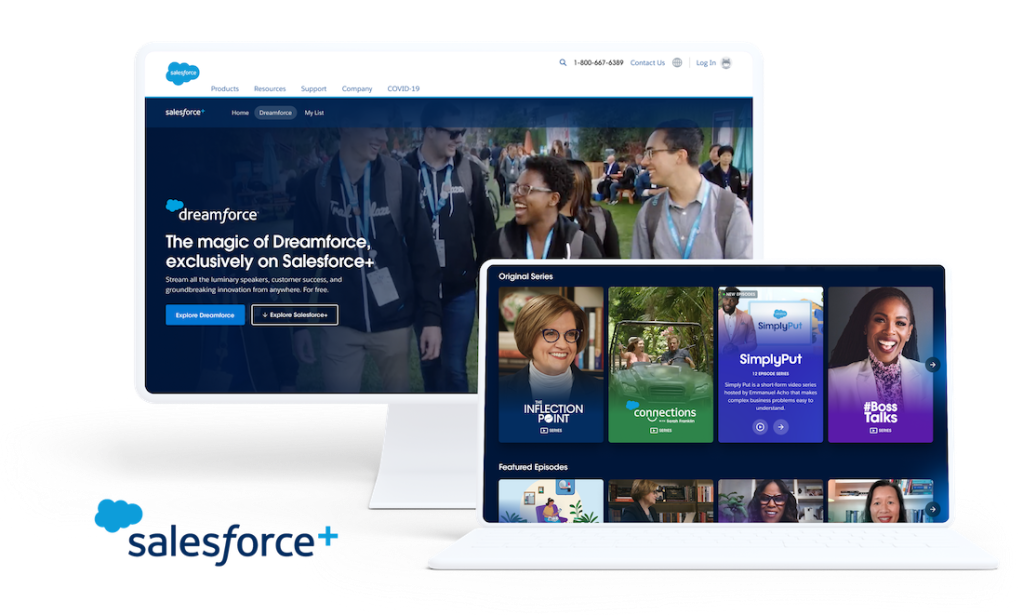
What is Salesforce + ?
Salesforce + is a new streaming service, it includes live experiences, original series, podcasts, and other programming. With engaging stories, thought leadership and expert advice, Salesforce+ will illuminate the future of technology in the digital-first, work anywhere world and inspire millions of Trailblazers to learn new skills, pursue new career opportunities, and drive change in the world.
The platform includes 4 channels :
✔️ Prime Time Channel: The best of Dreamforce includes the latest news and announcements from Salesforce and the most inspiring stories of customer success and transformation from Marc Benioff, Salesforce executives, global leaders, and changemakers.
✔️ Trailblazer Channel: Viewers can learn from fellow Trailblazers — pioneers, innovators, and life-long learners — and discover how to use Salesforce to build a successful career, company, and community. The latest Customer 360 product innovations come to life here as well, with sneak peeks at the Salesforce product roadmap.
✔️ Customer 360 Channel: Success stories direct from the Trailblazers who have lived them, and behind-the-scenes content highlighting innovations from the Salesforce experts who created them.
✔️ Industries Channel: Stories of how industry innovators are driving growth and reimagining their industries in an all-digital, work anywhere world.
How to start with Enterprise data journalism ?
Traditional reporting extracts data but is static, only providing a summary of information without much detail (ex : Business Object, Excel …). Dashboarding, on the other hand, is built to visualise and organise data in real-time with :
- Storytelling : translating your complex data analyses into a creative story for end-user.
- Data Journalism collects, filters, and presents information in an attractive way to explore data and easily create visual stories.
To request a data design audit with Tableau, please check our data design page to fill in the form and we’ll get back to you within 48 hours. 👇
Author Profile

- Hi, I'm a digital marketing fashionista ! I'm passionate about covering topics like big data, business intelligence and Artificial Intelligence. SEO for the sake of Google 🙂
Latest entries
 News15 December 2021[Tableau 2021.4] Explore and learn more about the latest release
 Webinars7 December 2021Financial controllers ! From spreadsheets (Excel) to visual workflows (KNIME)
 News8 October 2021Salesforce + : watch our video “From Reporting to Enterprise Data Journalism with Tableau “
 News23 July 2021From spreadsheets to workflows
